Like many women, my wife Liz often worries about her weight. A few months ago she decided to make a determined effort to avoid high calorie foods and to get more exercise. She started weighing herself frequently and recording the results in her diary. However, it never seemed to occur to her to plot a graph of the results. Instead she seemed to judge her progress on whether the current measure was up or down on the previous one. She would come home and say "I've put on 2 pounds!" and be sad, or "I've lost 2 pounds!" and be happy.
I tried to explain to her about measurement error and that 2 pounds was probably not a significant difference, but she just wouldn't listen. On one occasion she became quite distressed because, apparently, she had suddenly "put on 10 pounds", only to find, to her great relief, that "it all came off again" the following day. I repeatedly told her that she should not be concentrating on the difference between the last two measurements but, instead, should be looking at the overall trend, and for that you need to plot a graph.
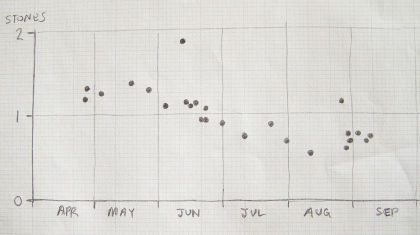
Eventually, I got her to sit down at the kitchen table with her diary and together we plotted the measurements out. The the result was the above graph (except that I have subtracted an arbitrary constant from all the values to disguise the true weights - we are only interested in the differences here). There are three things to notice about this graph:
- The points show a clear and unambiguous downward trend. Liz is successfully losing weight: over 4 months she had lost about 7 pounds. I was surprised by this; from the way she had been going on I had assumed that she must be actually putting weight on.
- All but 2 of the points scatter within a few pounds of the downward trend line. I was correct in saying that a difference of 2 pounds between two consecutive measurements was not worth worrying about.
- However, there are 2 points that stand well above the trend line and these require some explanation. But they are almost certainly not the result of Liz suddenly putting on a lot of weight and then losing it all the following day. Somehow those measurements must have been faulty. There are various ways this could happen but I like to think that Liz forgot to put her handbag down before she stepped onto the scales.
Without plotting the graph, Liz would probably never have realised that her weight was slowly and steadily going down. Instead, she would have continued to be distracted by insignificant changes and the occasional faulty measurement. With the graph these can be clearly seen for what they are: irrelevant. Indeed, I would go as far as to say that any method of weight loss should include graph plotting if it is to be effective. Anyone attempting to lose weight must get a feel for how their weight changes over time and a graph is the best thing for giving that feel.
(Postscipt: The latest measurement, on September 15th, comes in at just under 0.5 stone on the above scale, so the downward trend is continuing. It looks as if Liz is on target for having lost 1.0 stone by November.)
 Tristram Brelstaff